


Need a Custom Template?
Here at Boulder Insight, we build attraction-based dashboards, and now you can too! Our templates provide a unique user experience, in which business and style go hand in hand. We want you to enjoy discovering new business frontiers, and double-checking your key metrics. Here’s what we offer:
Custom Templates
• We’ll fit the background to your data, saving the hassle of reformatting it yourself.
___________________________
Basic Template Features
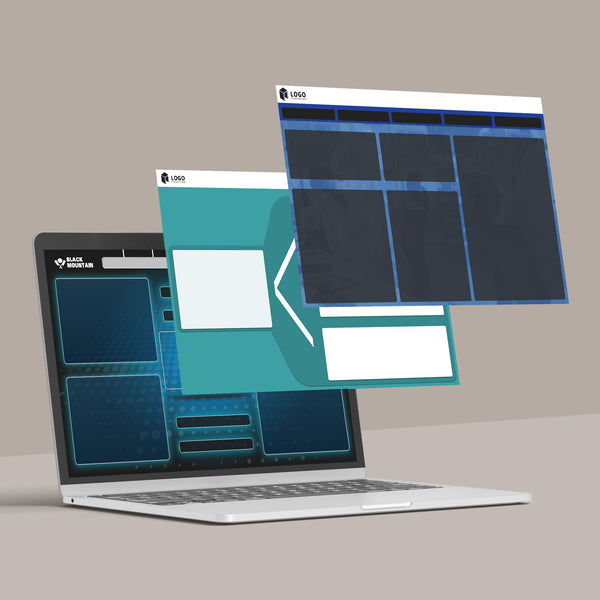
Logo: The logo is a minor detail, but lends weight to your dashboard. With this in place, the graphs are yours, and you can take pride in knowing whom this data is for.
Key Metrics: A valuable asset to any report is applying key metrics. “Yes, the charts are cool, but what’s the bottom line?” The way that we put in our key metrics sets them apart from the rest of the data, and gives them their due importance. The dashboard can also appear cluttered without any separation between different aspects of the whole, so these boxes are very important in creating that space.
Drivers: Like most of the Internet, we put our driving filters on the left. Since our language is read from left to right, it’s key to put our first interactions on the side that clients glance at first. There’s also separation from the body of the dashboard too, so the driving actions and meat of the dashboard don’t confuse users.
Data Story: The middle of the dashboard is where our story hits home. We don’t overload the screen with graphs, because we believe that with the help of driving filters, the story can be told with easy to understand charts that inspire action from the end user.